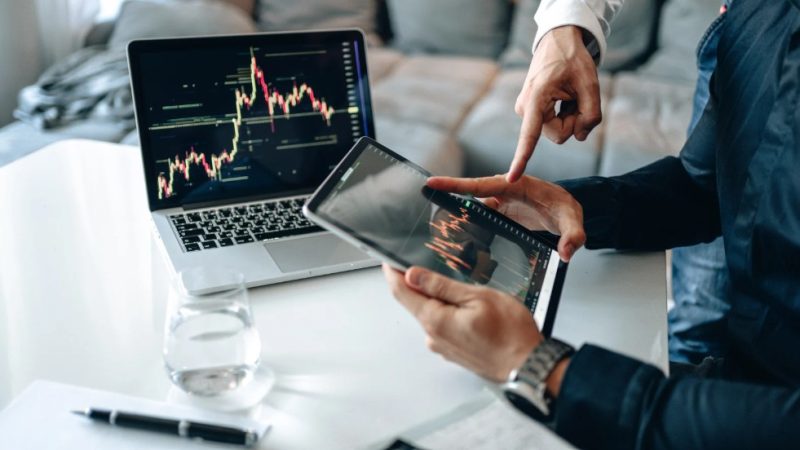
The first time you look at a cryptocurrency chart, you might feel completely lost. Between the squiggly lines, colourful candles, and unfamiliar terms, it can feel like trying to read a foreign language. But over time, you’ll realise that learning how to read crypto charts isn’t just for expert traders.
It’s a fundamental skill that any serious crypto enthusiast should have, especially if you’re looking to make smart, data-driven decisions.
In this guide, you’ll walk through the basics of understanding and analysing crypto charts. From recognising patterns to interpreting key indicators, everything here is tailored to help you make sense of the chaos.
What Are Crypto Charts and Why Should You Care?
Crypto charts are visual tools that show how the price of a digital currency moves over time. They’re not just for professional traders, they can offer you a clearer picture of the market, especially if you are new to crypto trading.
Once you begin studying charts, you’ll notice a huge improvement in how you approach trades. You won’t be relying on news headlines or social media buzz anymore. Instead, you’ll use actual price behaviour to guide your decisions.
Being able to analyse these charts will help you understand market sentiment, spot potential entry points, and avoid risky decisions. In essence, learning to read crypto charts gives you real control over your cryptocurrency investments.
What Types of Crypto Charts Should You Know About?
There are a few different types of charts, and each one presents data in a slightly different way.
Line Charts
This is the most straightforward chart you’ll come across. It connects closing prices over time, forming a single continuous line. While easy to read, it doesn’t show much detail, such as how high or low the price went during a given period.
Bar Charts
These charts add more depth. Each vertical bar represents a set period and shows the open, high, low, and close prices. Though informative, bar charts might feel a bit too cluttered when you’re just starting out.
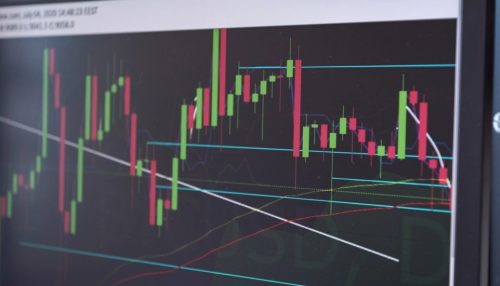
Candlestick Charts
The candlestick chart may quickly become your go-to. It packs a lot of data into a single candle, including open, high, low, and close — all while offering a clear, colour-coded view of whether prices moved up or down. Each candle tells a small part of the overall market story.
Bullish candles, usually green, indicate that the price went up during that time frame, while bearish candles, typically red, show that the price dropped. Once you grasp this visual language, it becomes much easier to spot crypto trends and patterns.
How to Reading a Crypto Chart?
The first step is simply observing how price movements play out over time. Watching price fluctuations will teach you to recognise when the market is trending upwards, downwards, or moving sideways in a consolidation phase.
Looking at the bigger picture, like the daily or weekly chart, helps you understand the overall direction. Then, zooming in on shorter timeframes allows you to refine the timing of your trades.
Pay close attention to volume. A price increase backed by high trading volume typically means the move is strong and more likely to continue. On the other hand, a low-volume breakout often doesn’t hold for long.
What Are the Key Indicators and Tools You Should Use?

As you get more comfortable with chart reading, you can start introducing indicators, analytic tools that provide additional insight into market behaviour.
The Moving Average (MA) is a great place to start. It smooths out price fluctuations, making it easier to see the general trend. You might prefer using the Exponential Moving Average (EMA) since it reacts more quickly to price changes.
Another valuable tool is the Relative Strength Index (RSI). It helps you determine whether a cryptocurrency is overbought or oversold. When RSI values go above 70, consider that the price might soon reverse downward. Below 30, there’s often a chance it could rise.
Support and resistance levels are also crucial. These are price zones where assets often pause or reverse. Use support to identify potential buy zones, and resistance to plan exits or short trades.
How Do Chart Patterns Help Predict Market Moves?
One of the most eye-opening moments will be when you start recognising chart patterns. These aren’t just random shapes; they represent the psychology of traders and can signal what’s coming next.
Reversal patterns, like the Head and Shoulders or the Double Top, indicate that the current trend might soon end and reverse direction. When you spot these forming, it’s time to reassess your position.
In contrast, continuation patterns such as flags, pennants, and triangles suggest the existing trend will likely carry on. Watching how the price moves after these formations will give you more confidence in your analysis.
What you must remember, though, is not to jump into a trade just because a pattern looks familiar. Confirmation through volume and price action is key.
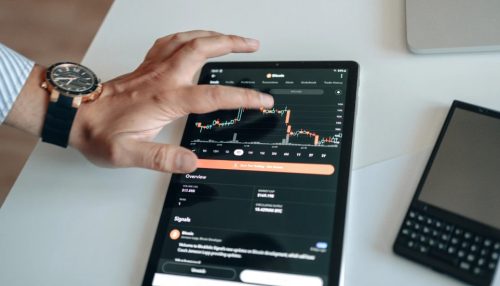
What Tools and Platforms Can Help You Practise Chart Reading?
When you’re starting out, experimenting with a few platforms to practise chart reading can be very helpful. TradingView stands out as the most intuitive and feature-rich. It offers a wide range of indicators, drawing tools, and customisable layouts. Best of all, the free version is more than enough for your needs at the beginning.
Other platforms like CoinMarketCap and CryptoCompare give you a broader look at market data and historical trends. If you’re trading on platforms like Binance, their built-in charts are also quite good.
Here’s a quick comparison of useful platforms:
| Platform | Best For | Access |
| TradingView | Technical analysis | Free & Paid |
| CoinMarketCap | Market overview | Free |
| Binance | Live trading + charting | Free |
| CryptoCompare | Historical price data | Free |
How Can You Build Confidence in Reading Crypto Charts?
What will help you the most is simply showing up daily and practising. Pick a coin, open its chart, and try to predict what might happen next, then check back later to see if you were right. Over time, you’ll see improvement not just in accuracy, but in how quickly you can interpret a chart.
Keeping a trading journal where you note what you see, what you predict, and the outcome can be very useful. This habit will help you identify patterns in your own analysis and avoid repeating mistakes.
Joining online communities and watching educational videos can also give you fresh perspectives and keep you motivated. The more you engage with others, the faster you’ll learn.
Quick Glossary of Common Chart Terms
| Term | Meaning |
| Candlestick | Visual bar showing open, close, high, and low prices |
| RSI | Indicator showing if an asset is overbought/oversold |
| Support Level | Price zone where buying tends to increase |
| Resistance | Price zone where selling tends to increase |
| Breakout | When price moves above resistance or below support |
| Trend Line | A diagonal line showing the direction of price movement |
Final Thoughts
Reading crypto charts is a skill, and like any skill, it gets easier with consistent practice. You won’t master it in a week, but as you keep at it, the patterns will start to make sense, the indicators will begin to align, and your confidence will grow.
Whether you’re just investing casually or planning to trade actively, developing the ability to interpret charts gives you an edge. It’s not about predicting the future perfectly, it’s about improving your decision-making with every candle and trend you analyse.
So take your time, keep learning, and don’t be afraid to make a few mistakes along the way. The charts are there to guide you, and now, you’ve got the tools to read them like a pro.